This post is part of a 6 part series. Jump to [part 1][part 2][part 3][part 4][part 5]
To sum up how we got here:
- We used PowerShell to gather some specific session stats from Citrix MFCom and output them to a text file. [part 1] [part 2]
- We then created a database and table to hold this data. [part 3]
- We created a job in Visual Studio to parse the text file and insert it into the above table. [part 3]
- We showed how to save the Visual Studio job directly to an MS SQL server and have that server run a job to insert new data on a periodic basis. [part 4]
- We constructed a web page using MS SQL Reporting Services to present the data in real-time. [part 5]
For this final post, I want to add another piece of information to my report (which I’ll refer to as a dashboard from here on out). I also will upload the report to the reporting services server so others can view the information.
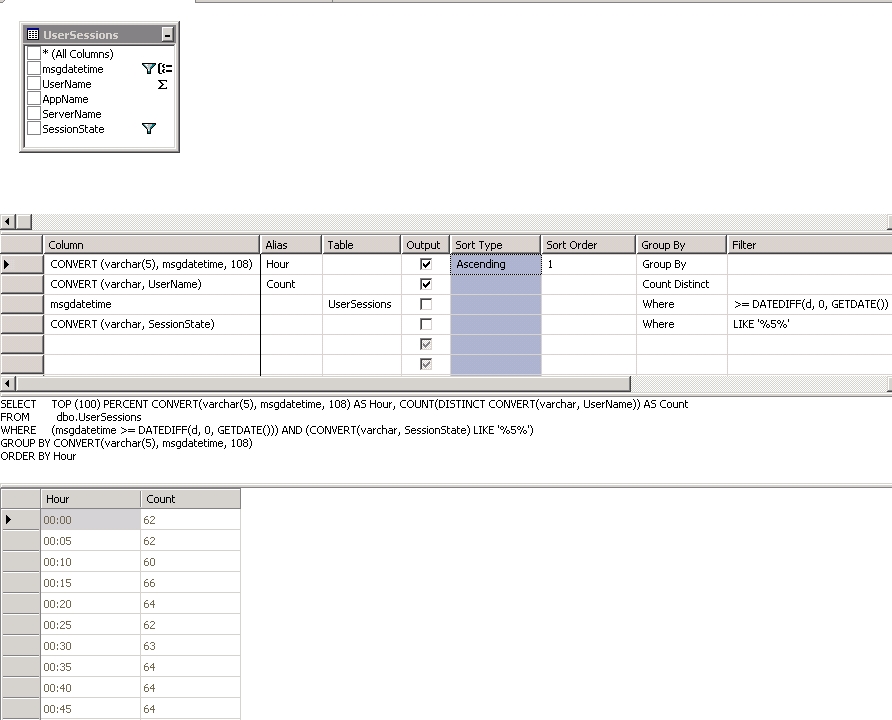
We currently already show the currently disconnected users in the farm (last 5 minutes or so). I also want to show the highest number of disconnected users for the day. One quick way is to create a view based on our original data. If we use the following query…
SELECT TOP (100) PERCENT CONVERT(varchar(5), msgdatetime, 108) AS Hour, COUNT(DISTINCT CONVERT(varchar, UserName))  AS Count
FROM dbo.UserSessions
WHERE (msgdatetime >= (datediff(d,0,getdate()))) AND (CONVERT(varchar, SessionState) LIKE '%5%')
GROUP BY CONVERT(varchar(5), msgdatetime, 108)
ORDER BY Hour
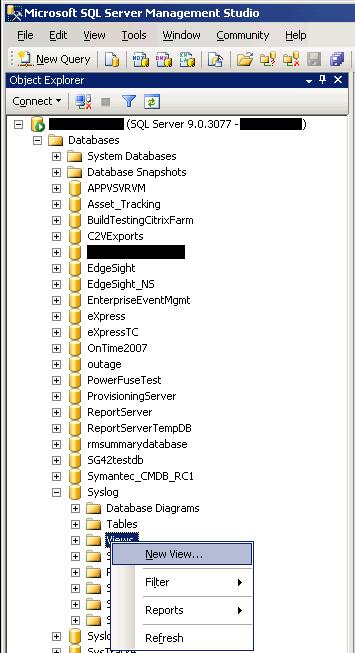
…we get a listing of total, unique disconnected users ordered by every 5 minutes for the current day. To create a view in MS SQL, I’ll open MS SQL Server Management Studio, login, open up our Syslog database and right-click on Views and select “New View…”
A view is just a persistent query. I’ll select the table we’re going to use and plug in the above query.
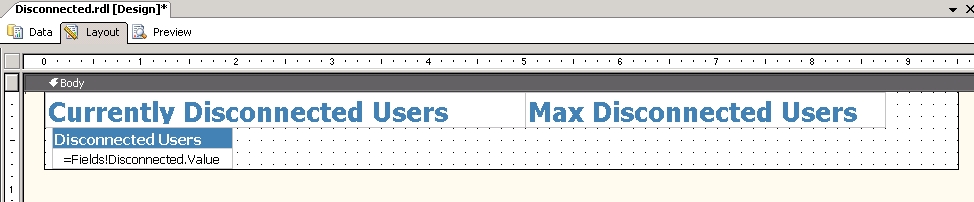
Saving it will name the view and make it available to future queries. Now we’ll add a new field to our report that will show the largest number of disconnected users for the current day and base the information on our new view. First, I’ll add a new text box…
and a new table object by clicking on Toolbox and dragging a table into the report.
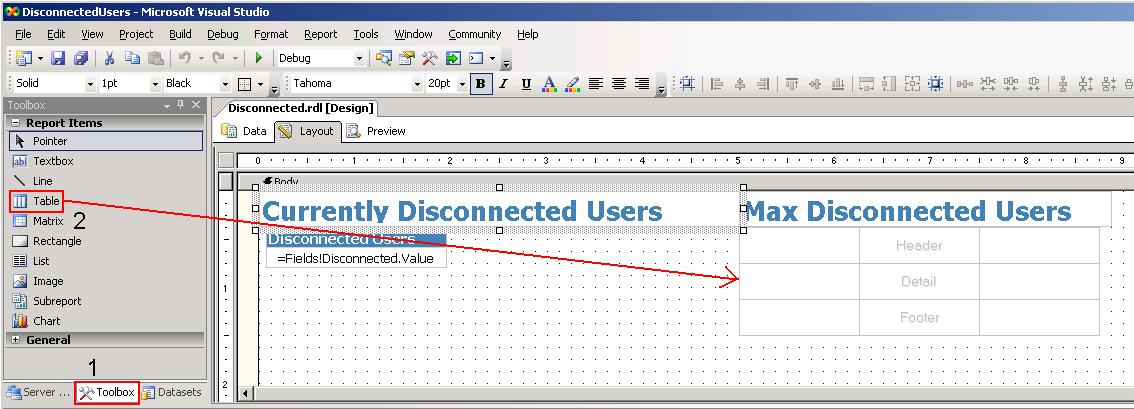
Remove the footer and a couple of columns and do some editing…

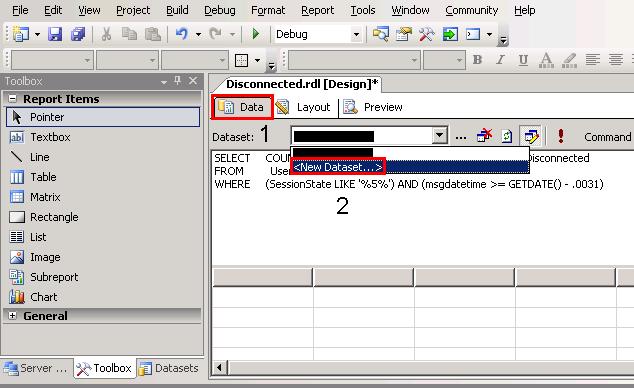
Now we’ll add a new dataset by clicking on Data and selecting new Dataset on the drop down list.
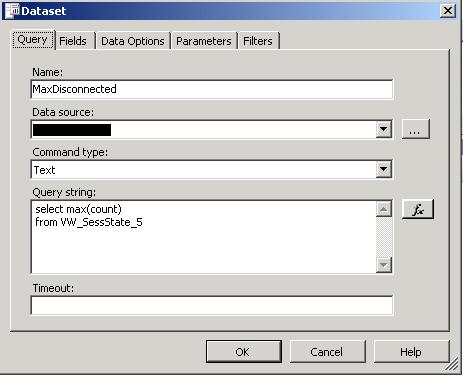
I’ll name the dataset MaxDisconnected and use the following query which just selects the maximum value (of disconnected sessions) from the view.
select max(count) as MaxDisconnected
from VW_UserSessState_5
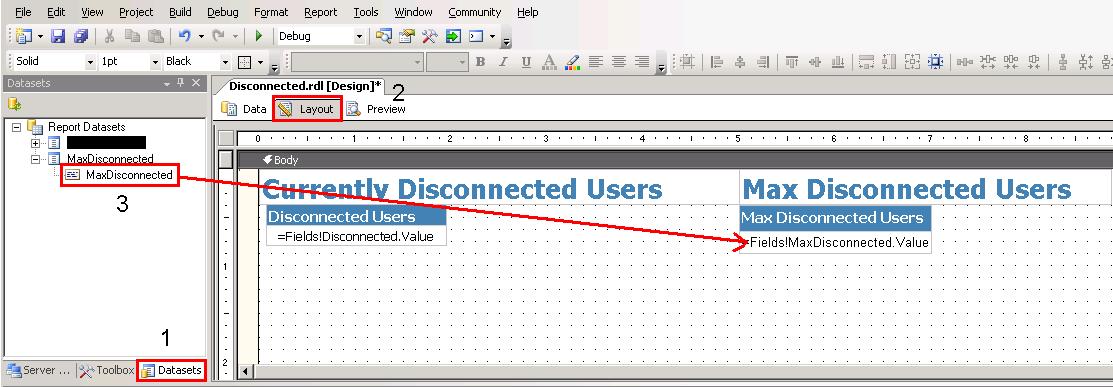
Now we have the new dataset. I’ll click on Datasets and Layout and simply drag the MaxDisconnected dataset into the table I created earlier.
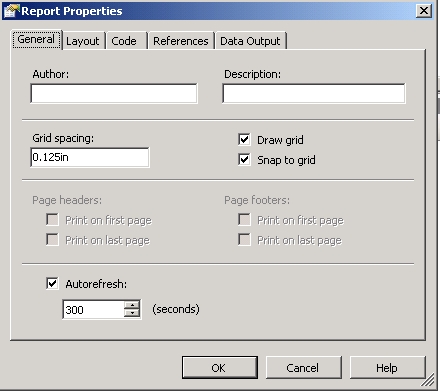
So, the report is complete. I want this report to automatically update every 5 minutes. Do to this, I’ll click on the Report Menu and select Report Properties. I’ll simply click on Autorefresh and set it to 300 seconds…
Now to import it to the reporting services server, we simply open our browser to the reporting services site:
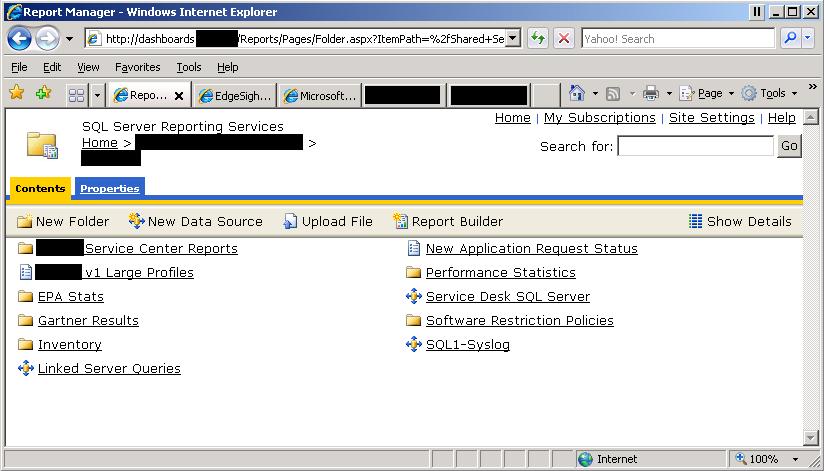
Click on Upload file and browse to the .RDL file.
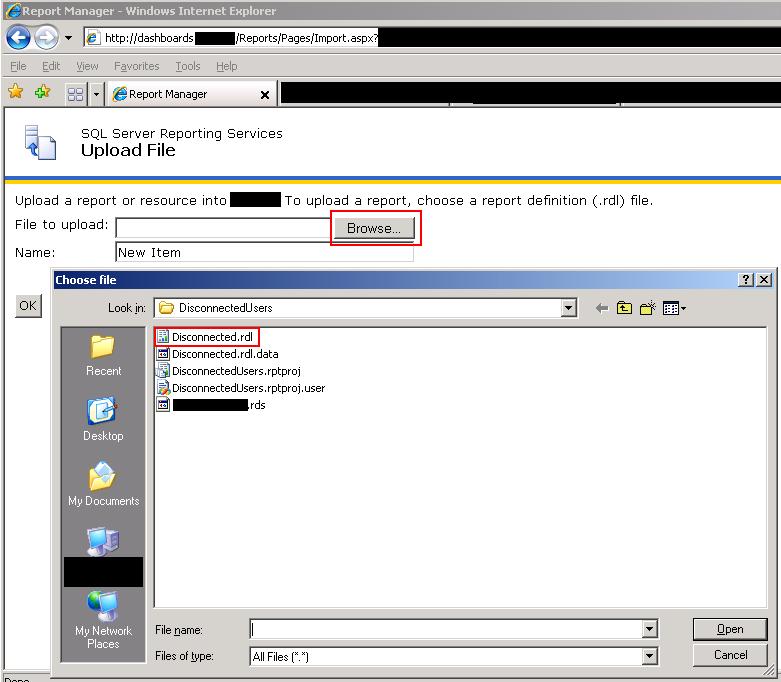
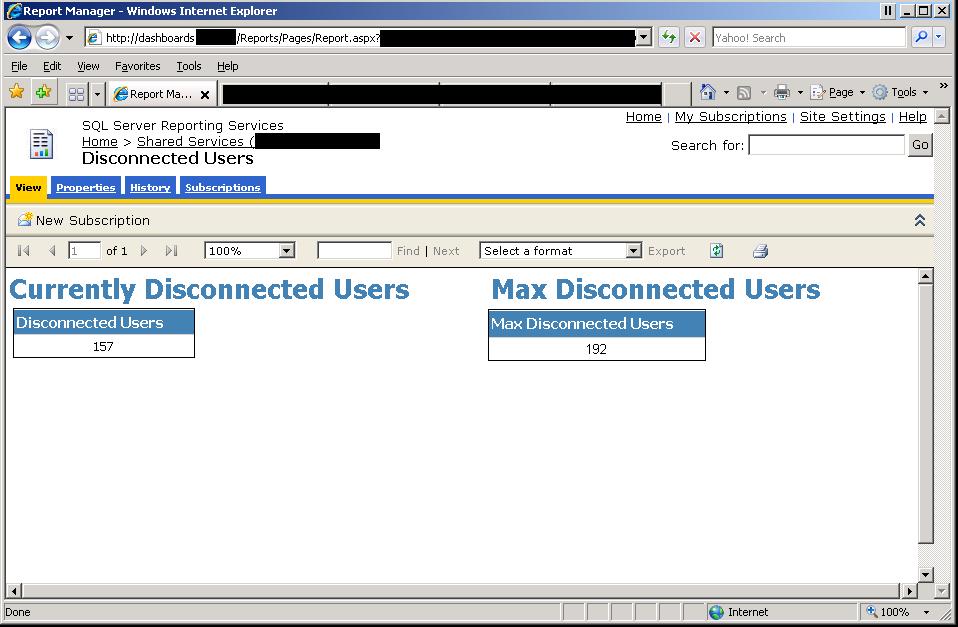
Name the report and click OK. Now the report will show up on the web page. Clicking on it will result in a failure, because we still have to associate a data source. Click on Properties and Data Sources. Set the data source, click OK, hit apply, and then view. The report will now render and will autoupdate every 5 minutes so will show the most recent data.
Thanks for viewing. I hope this gives you a basic introduction to using several tools to present data in a simple way (even though the method may be complicated). As a system administrator/engineer you (hopefully) typically have a reporting tool of some sort, but giving superiors or other teams access to it may prove to be more difficult or confusing than intended. Using SQL Reporting Services allows you to show data in a simple form to a wider audience.
Please feel free to ask questions/comment. The methods described in this series have worked well in our environment, but I’d love to hear what others are doing to place metrics, stats, and such front and center.
This post is part of a 6 part series. Jump to [part 1][part 2][part 3][part 4][part 5]
Value for Value
If you received any value from reading this post, please help by becoming a supporter.
Thanks for reading,
Alain