This post is part of a 6 part series. Jump to [part 1][part 2][part 3][part 4][part 6]
To sum up how we got here:
- We used PowerShell to gather some specific session stats from Citrix MFCom and output them to a text file. [part 1] [part 2]
- We then created a database and table to hold this data. [part 3]
- Following this, we created a job in Visual Studio to parse the text file and insert it into the above table. [part 3]
- Then, I demonstrated how to save the Visual Studio job directly to an MS SQL server and have that server run a job to insert new data on a periodic basis. [part 4]
Now that we have new data automatically entering our database table every 5 minutes or so, we can construct a web page using MS SQL Reporting Services to present the data in real-time. For this example, we’ll create a real-time report that shows the currently disconnected users in my Citrix farm.
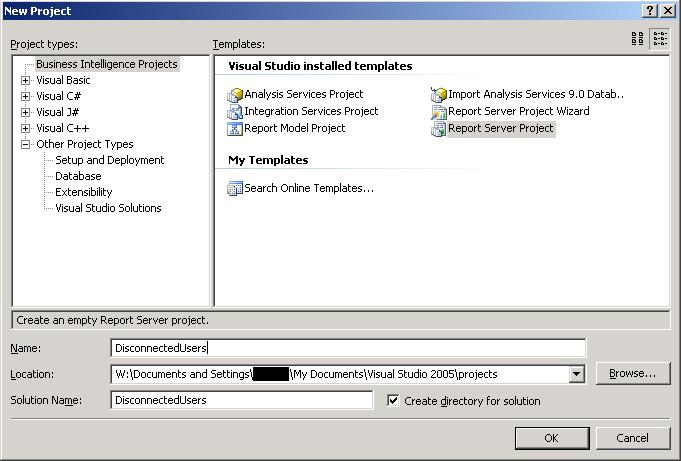
Open Visual Studio and open up a Report Server Project.
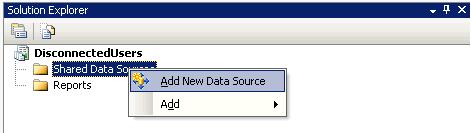
Now we’ll create a Shared Data Source to connect to our database server by right-clicking on Shared Data Sources and Add New Data Source.
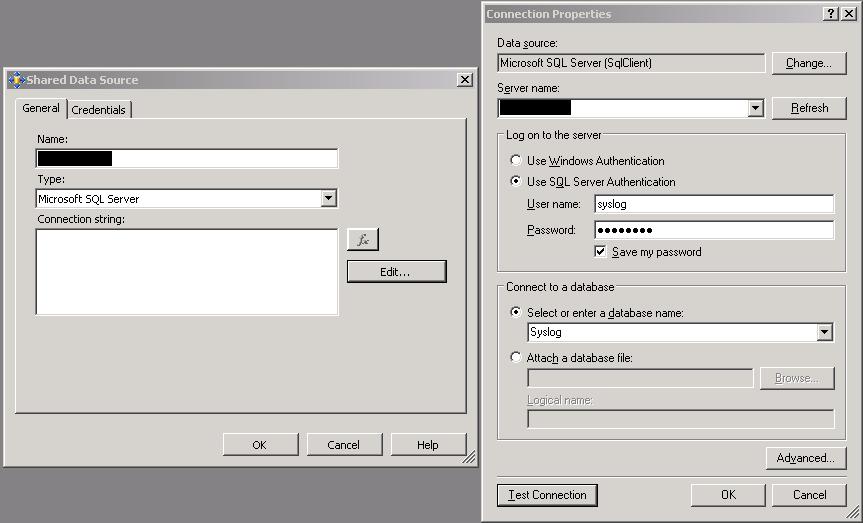
We’re connecting to an MS SQL server, click Edit to enter the connection information, and choose the database we’ll query for our data.
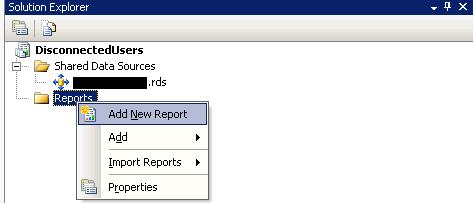
Now we’ll add a report by right-clicking on Reports and (amazingly enough)
select Add New Report
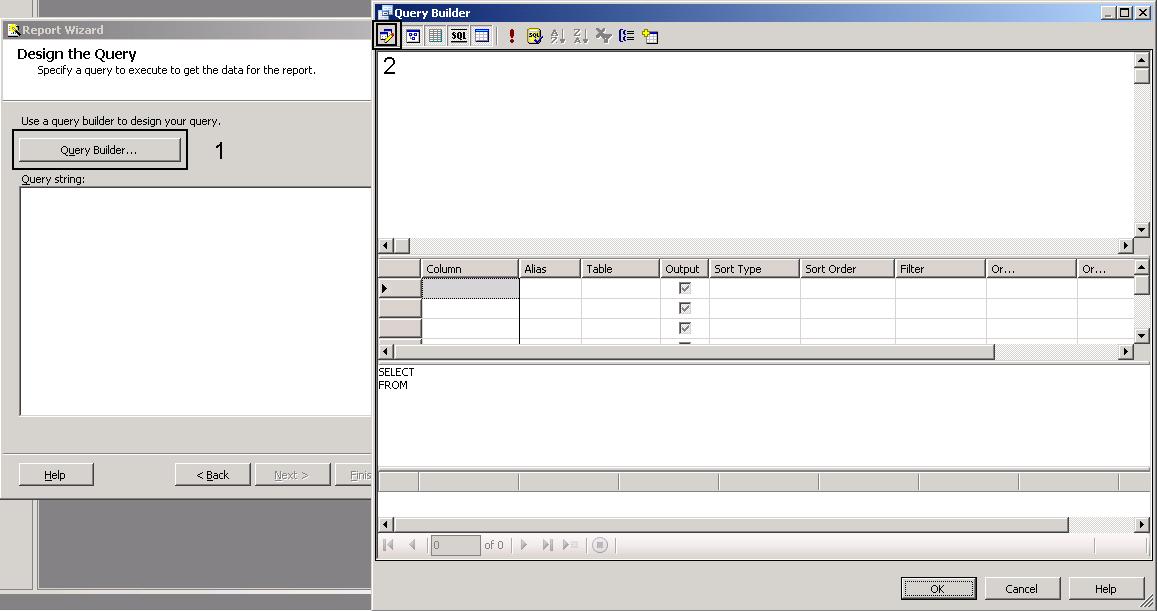
This will bring up the Report Wizard which we’ll follow for this example. First, I’ll use the data source we’ve already created. Since it’s already selected, we’ll click Next and move on to the query builder. Here, we’ll create an SQL query that will gather the data we want to display in our report. Click on Query Builder, then click on the Generic Query Designer button to bring up some QBE (query by example) tools.
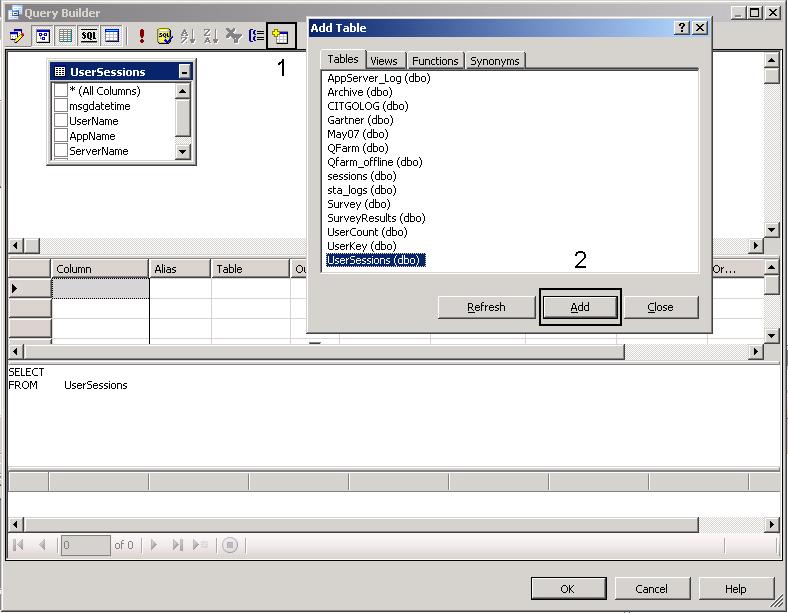
Click on the Add Table button and select the table we want to query from.
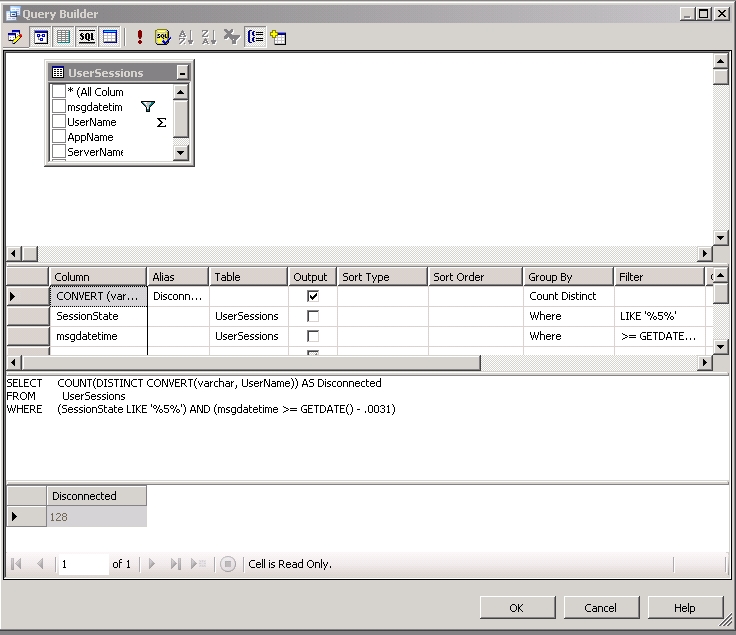
So, for this example, I want query this table to get the number of disconnected users currently in my Citrix farm. So, I’m looking for a session state of 5, I just want to count each user once, and I only need the last 5 minutes since this is the update interval of the table. Here’s the query I’m using to get this data.
SELECT COUNT(DISTINCT CONVERT(varchar, UserName)) AS Disconnected
FROM UserSessions
WHERE (SessionState LIKE '%5%') AND (msgdatetime >= GETDATE() - .0031)
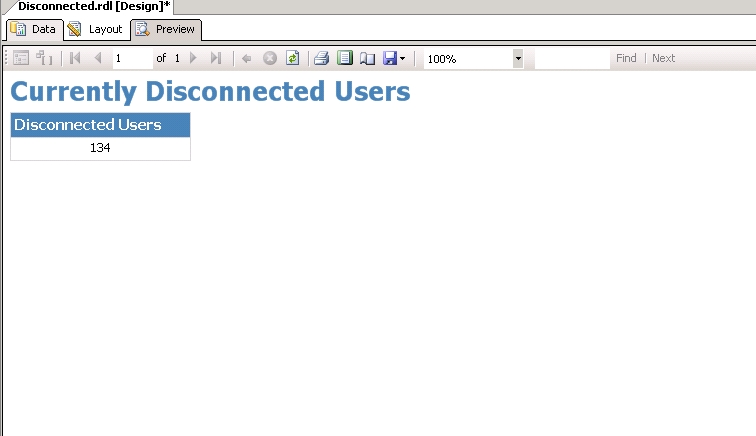
This gives us the information we need, so I’ll click OK and go back to the Query builder and click Next. We’ll choose Tabular for the report type, click Finish, and name the report. This takes us to the design view, where we can format the report. Hitting the Preview tab let us see how the finished report will look (I made some minor layout changes and added some text).
For the final post in this series, we’ll create a database view so we can show the currently disconnected users and the maximum disconnected users for the current day and upload the finished report to our Reporting Services server for public viewing.
This post is part of a 6 part series. Jump to [part 1][part 2][part 3][part 4][part 6]
Value for Value
If you received any value from reading this post, please help by becoming a supporter.
Thanks for reading,
Alain