NOTE: I was not asked by Tricerat to review their product, but I am taking a look at it to see if it would provide better visibility to my current XenDesktop/XenApp environment.
Intro
Citrix is a blessing and a curse for any virtualization admin. A blessing, because it allows you to deliver your company’s resources in a very dynamic, flexible and secure way. A curse, because Citrix touches every aspect of your company’s infrastructure, and as any Citrix admin knows, any fault or degradation in that infrastructure can be magnified in your Citrix environment.
If you’re lucky, you have the tools to identify these faults and if you are really lucky, you can inform other support teams to fix their problem. More often than not, this is a luxury and you have to rely on EdgeSight and whatever troubleshooting skills you have developed to fix problems like this. I’m not knocking EdgeSight, but it still requires a dedicated resource to configure, manage, and monitor and has little to no visibility into the other layers that make up your environment.
With more and more environments moving to the cloud, reporting and monitoring can be hampered due to the following reasons:
- Your cloud provider only offers/supports one monitoring tool.
- Your cloud provider only allows access to the application layer so you cannot install an appliance on a hypervisor, so you must use a product like EdgeSight.
- Your cloud provider’s architecture is so abstracted that monitoring is very limited (i.e. Amazon’s Workspaces).
- Your cloud provider does not want you digging into their architecture and pointing fingers at them.
When you’re working in a cloud environment, there are more variables that are out of your control. I’m reviewing various monitoring solutions that I hope will help me deal with performance issues in my cloud deployment and give me insight to the Cloud Provider’s resources as well as issues with my corporate resources.
Tricerat
Tricerat, known for addressing the terrible state of printing in virtual environments, has developed a monitoring solution that “…provides out-of-the-box functionality and setup wizards that enable administrators to monitor their XenApp and XenDesktop deployments across the physical and virtual infrastructure, to determine root causes and automate fix actions.”
Install
Downloading the 30-day trial is as simple as providing some contact info and downloading the setup file (both 32-bit and 64-bit available). It is recommended that you perform the install with an account that is a domain admin and also a farm admin of your XenApp, XenDesktop, and PVS farms.
Setup
I’m using Slideshare to present the install screenshots
Note:If you are installing Simplify Monitoring on a system that already hosts a web site, you should run MonitorITCFU.exe which is located in the \Program FIles (x86)\Simplify Monitoring\Bin folder. This utility will allow you to change the HTTP port to something other than 80 which is the default. When you open it, you must go to File –> Open and select the Default.btc file to make change. Once you’ve saved your changes, then stop and restart the “MonitorIT Server Service”.
First Launch (after a reboot)
Hey, look! A desktop icon. Let’s click on it:

If you’ve looked at several monitoring solutions, the below interface will look familiar…
This is the same monitoring product that Goliath Technologies has OEM’d to other companies. Let’s give Tricerat the benefit of the doubt and see what their years of experience gives us.
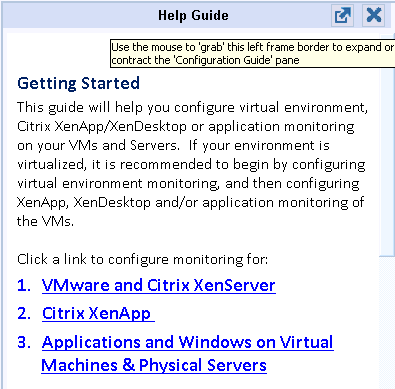
First, there is a Help Guide:
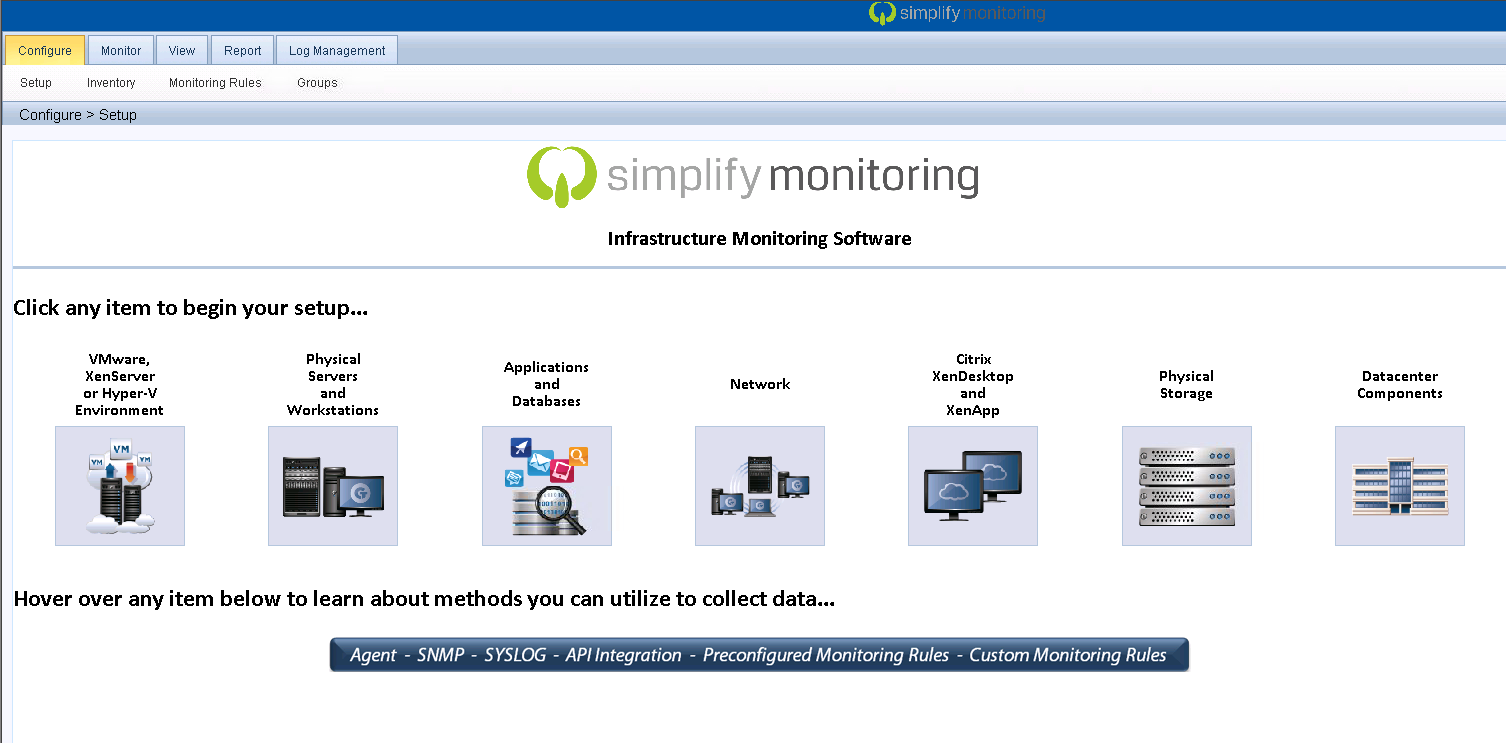
My environment is based on VMWare, so let’s see how that is configured.
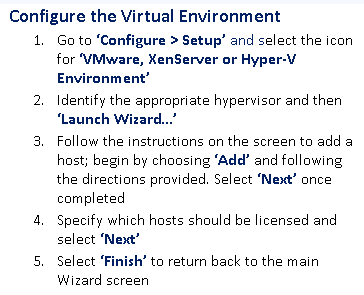
I added my vCenter server…
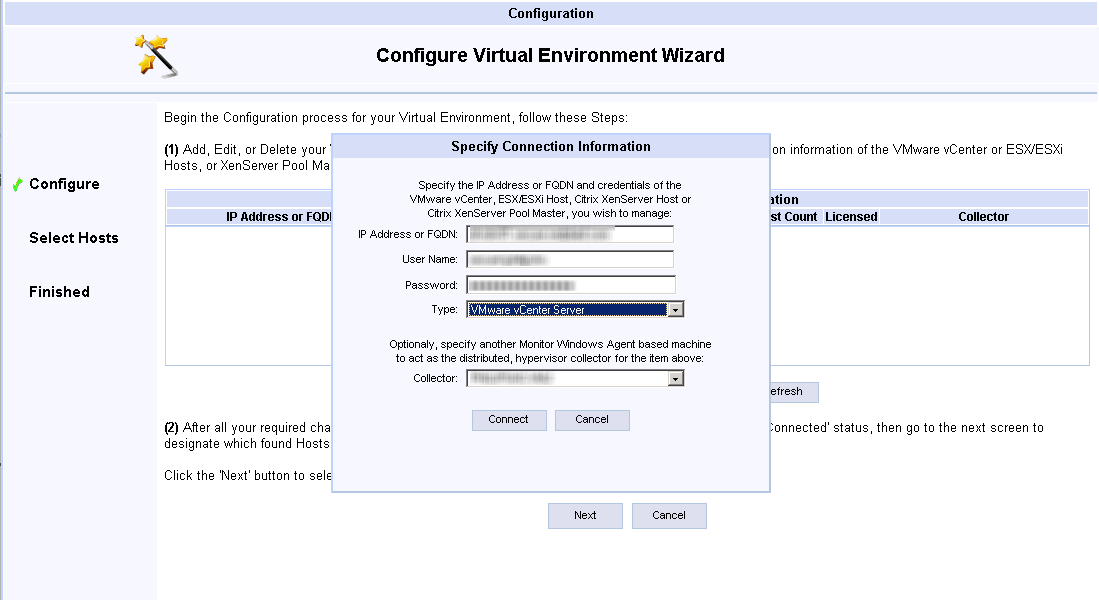
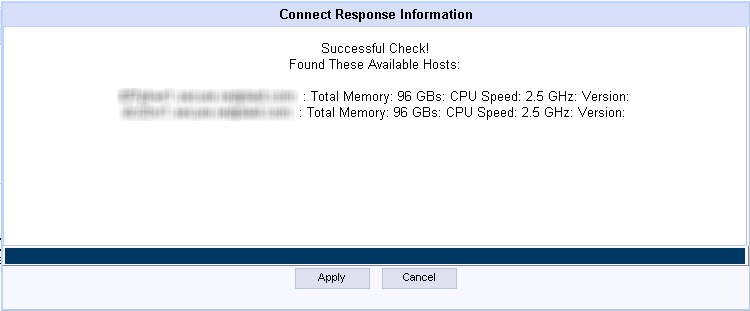
…and my hosts were added…
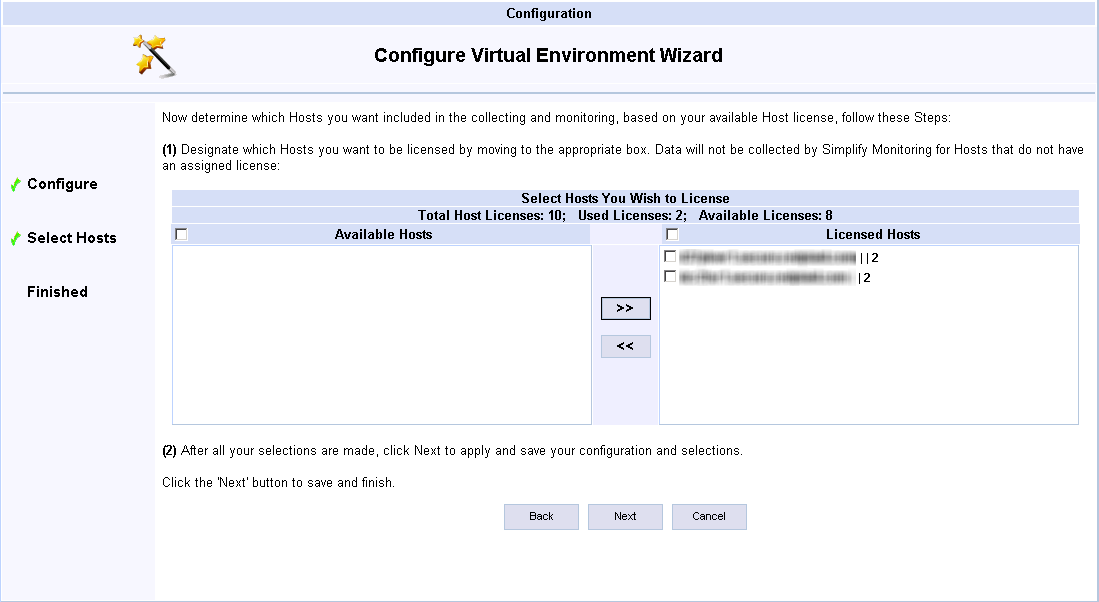
Clicking Next goes to the Host Licensing screen. You are limited to 10 hosts in the 30-day trial:
After completion, you are presented with an option to install Simplify Monitoring’s Console as a Plug-In into vCenter.
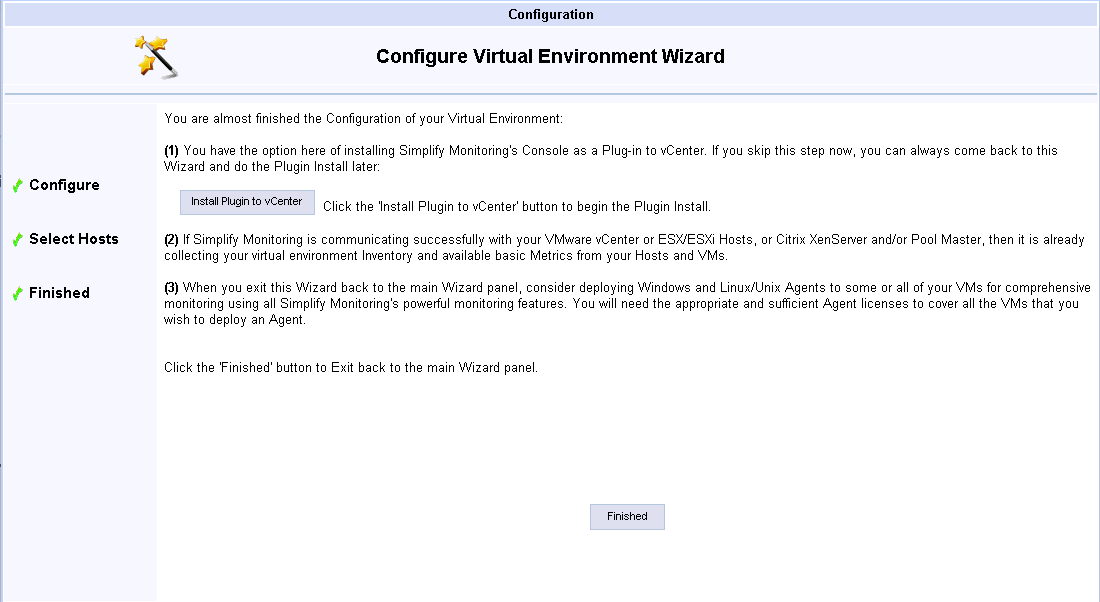
After you exit this wizard, you presented with a next step configuration guide.
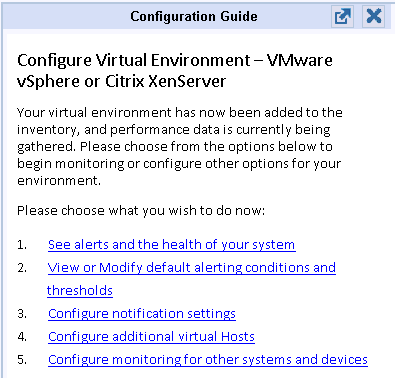
So, I want to “See alerts and the health of your system” to see if there are any red flags I did not know about.
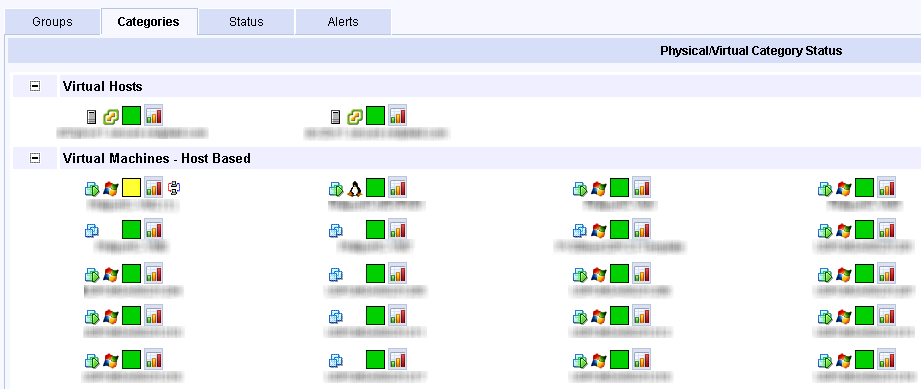
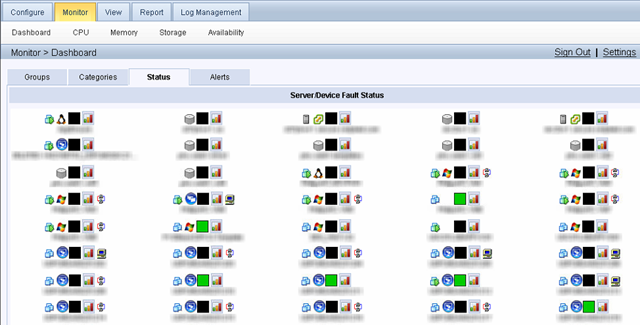
Hey, one of my servers is showing yellow. As you can see from the icons, we’ve got the typical RYG alert, the type of system (ESX, Linux, Windows), and the system status. After a few seconds, I got lots of red…
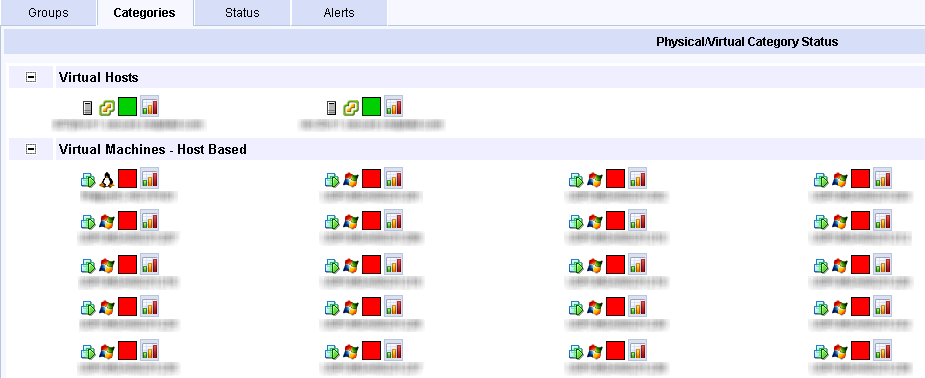
Time to panic? Let’s dive in and see what the alert is about (you can sort the system status to only show faults and to move all the faults to the top - which is why the above picture only shows red). The first system is a virtual NetScaler, so I’ll click on one of my XenDesktops to see what is triggering the alert.

The alert is due to available logical drive space. Clicking on the Watch/Alert Detail (the icon under Inf in the above picture) gives us…
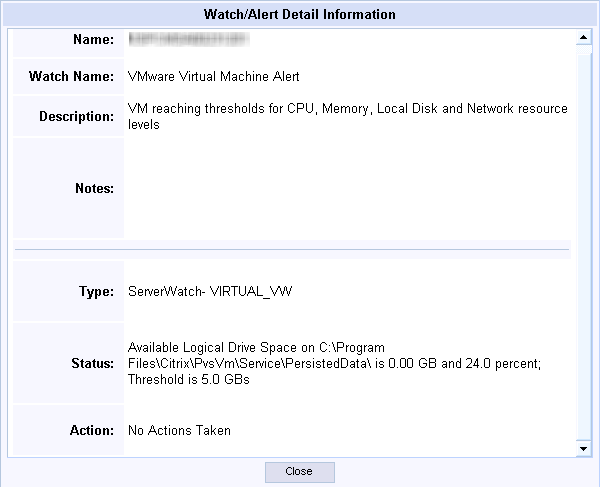
Again, this environment is very new to me. The above location is created when MCS is used. I know that PVS was used in this environment, but it is not active now, so this alert is correct, but not relevant. Let’s see if we can silence this alert and see what else is going on. Going back to the Configuration Guide, I’m going to click on “View or Modify default alerting conditions and thresholds”
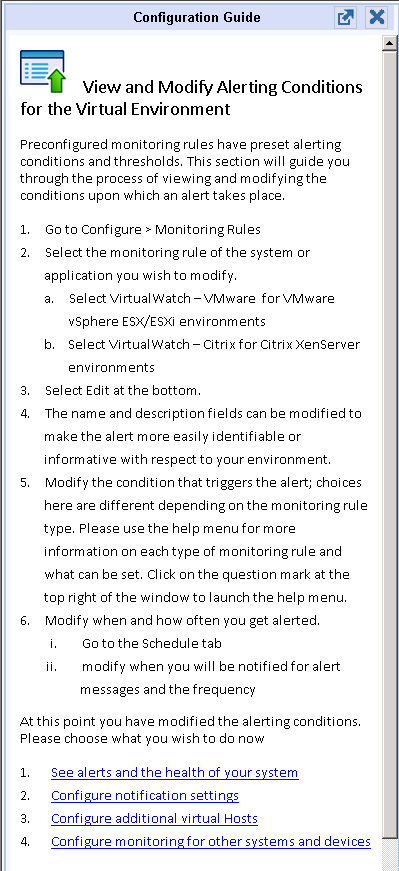
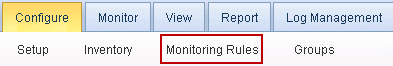
To configure Monitoring rules, click on the Configure tab and then Monitoring Rules.
The rule we want, “VMWare Virtual Machnine Alert” covers all major metrics.
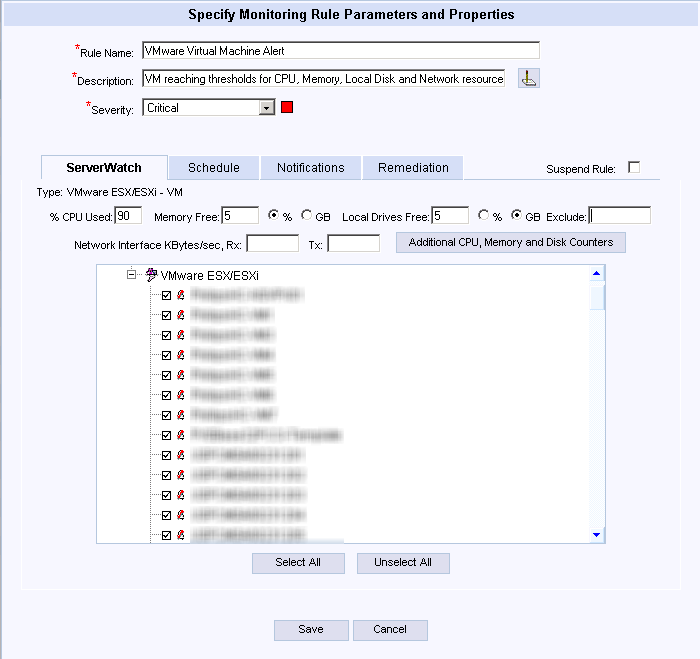
I added the path (not including the drive letter) that was causing an issue to the Exclude field and then acknowledged those existing issues. Now back to the dashboard to see what we can see.
Yeah, but what about my Citrix environment?
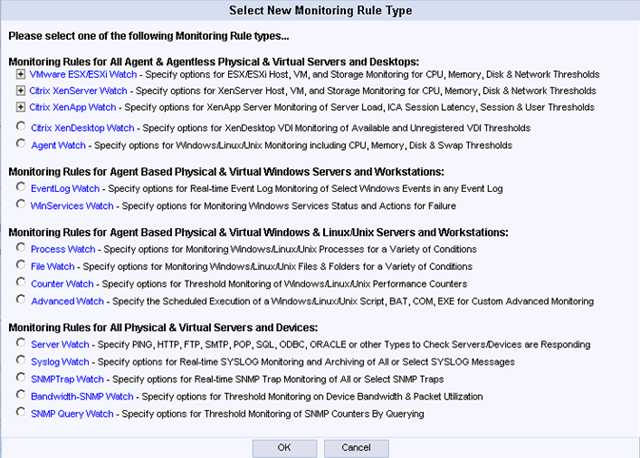
Simplify Monitoring provides many different built-in rule sets that cover all major components of a Citrix environment:
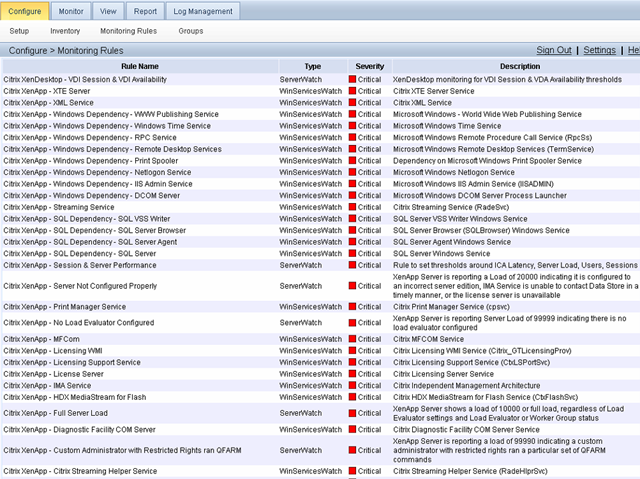
Note the Windows and SQL dependency checks that are related to delivering Citrix XenApp. Each rule can be assigned to a server or set of servers. When you select a rule you can click on Edit to get more detail.
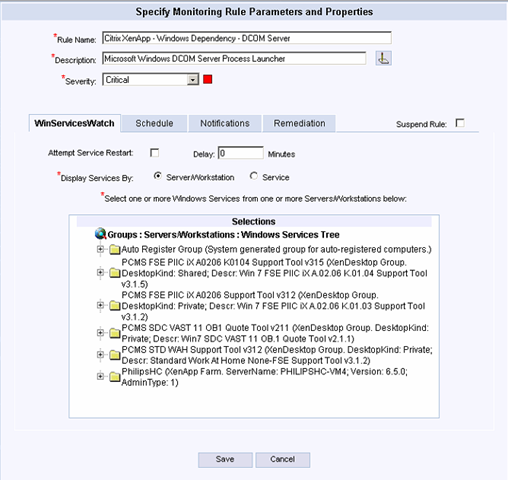
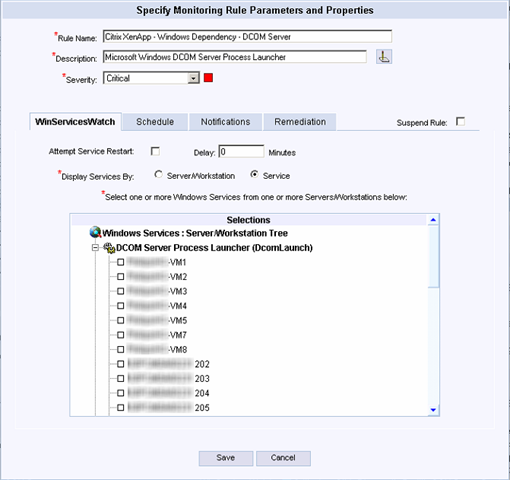
This screen allows you to assign the rule to a group of servers. If you click on the Service radio button, the screen changes to show the service that is monitored and all systems that are running an agent. This may be easier to assign the rule in your environment:
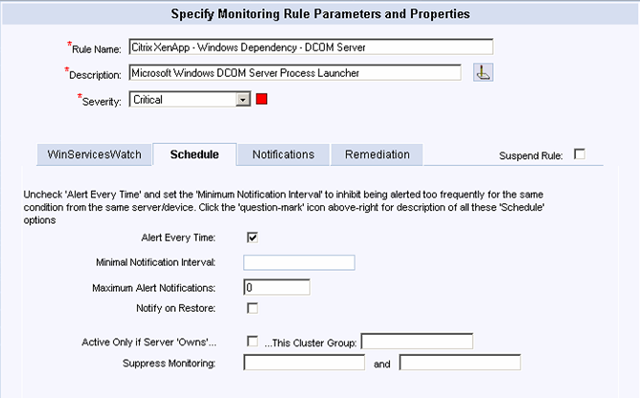
You can also configure the schedule of the alert…
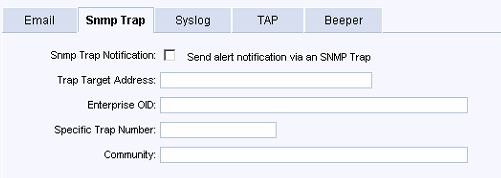
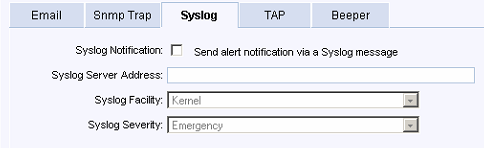
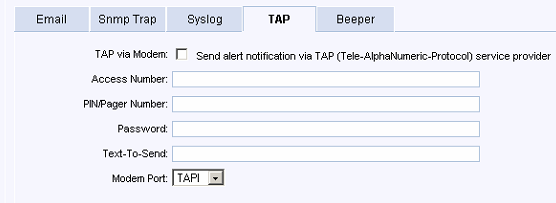
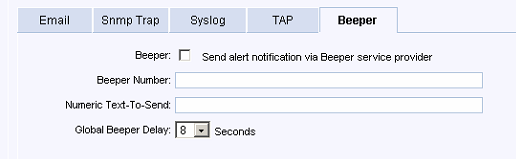
…the method of notification…
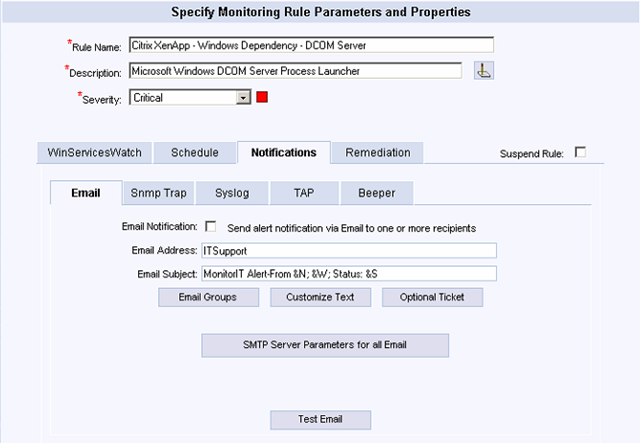
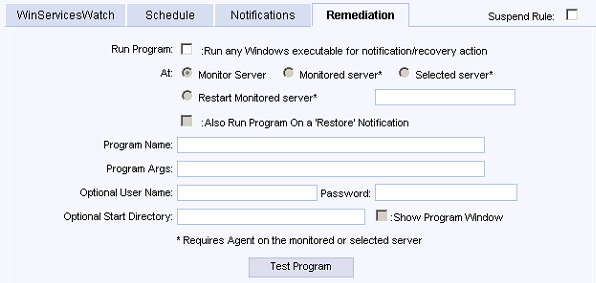
…and any remediation methods…
You can also recreate custom rules to monitor any number of items/systems:
How do I see it all?
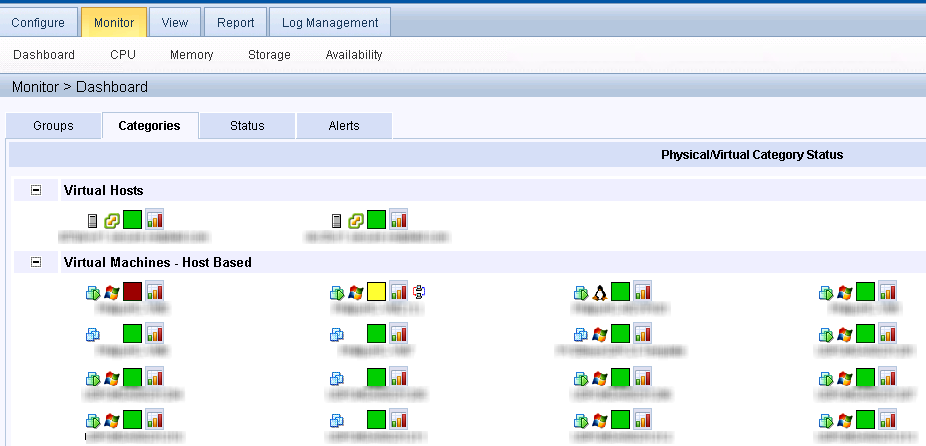
To see your alerts you go to the Monitor Tab. The first screen will be the groups (if any) that were configured.
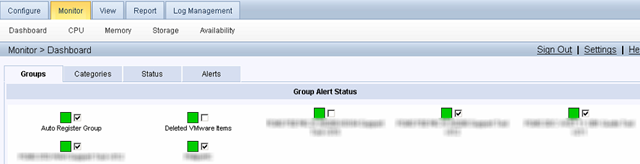
You can click on Categories to see your infrastructure grouped:
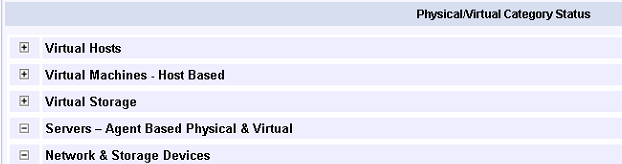
Status will show all detected devices in your environment:
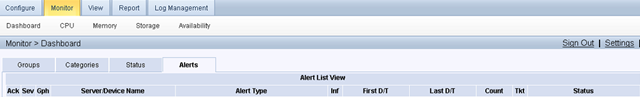
Alerts will list all currently detected alerts.
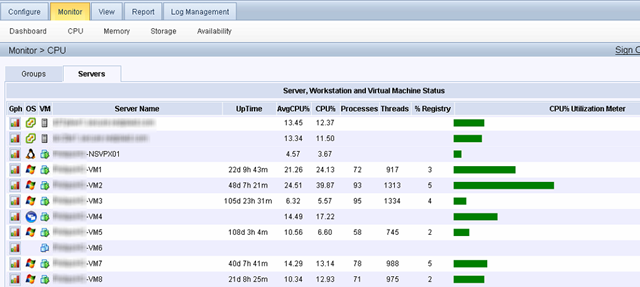
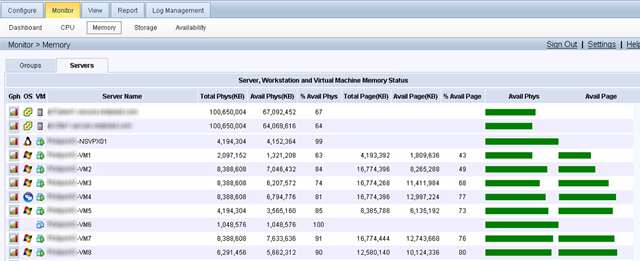
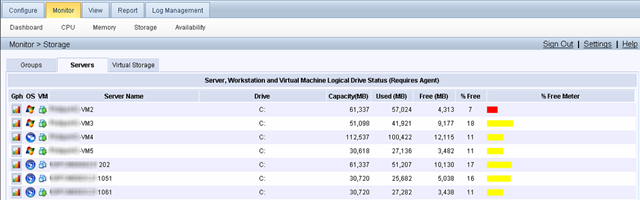
If you click CPU, Memory, Storage, and Availability you will get a high-level look at these metrics. You can sort on any column by clicking on it.
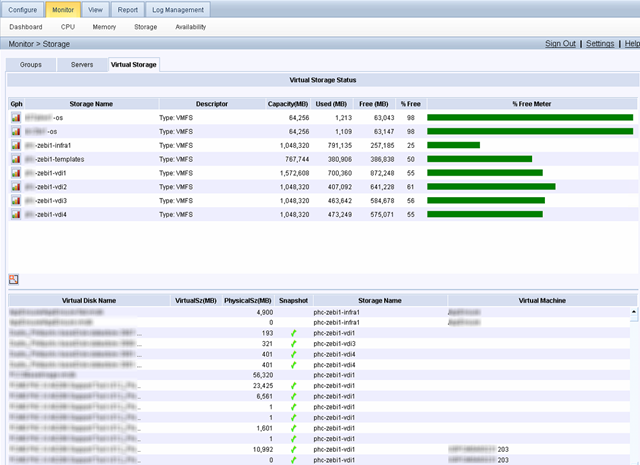
You can also see your datastores from the perspective of your hypervisor if you click on Virtual Storage.
Tricerat has also included a nice graphing module and covers the main pain points of monitoring a system holistically. I unfortunately do not have any graphs from my environment available, but I grabbed a screen shot from a presentation here to give you an idea:
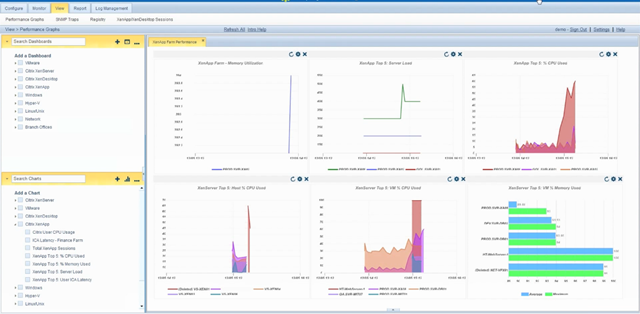
You setup a dashboard and add graphs to it. It’s a nice view of your system and you can cycle through different dashboards to show you your VMWare, XenApp, and XenDesktop environments.
Reports
You can also schedule and run reports on most metrics in your environment. I’m not able to show any screen shots of this, but I would recommend viewing a nice video of the major features of Tricerat Simplify Monitoring here:
Value for Value
If you received any value from reading this post, please help by becoming a supporter.
Thanks for reading,
Alain