Intro
If you rely on EdgeSight to provide accurate and timely information about your farm you have to assume that all your EdgeSight Worker Agents are functioning as expected. Or do you? In this post, we will review the information that the EdgeSight console provides you as well as creating a dashboard that can give you a detailed information on your EdgeSight Worker agents.
EdgeSight Console: Configuration Tab
The first place you can review the health of your EdgeSight server and its agents in under the Configuration Tab
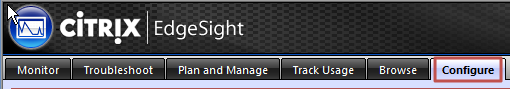
Along the left-hand side of this screen you will see way to configure your workers, alerts, and other server settings. We’re going to spotlight some items under Server Configuration and Server Status.
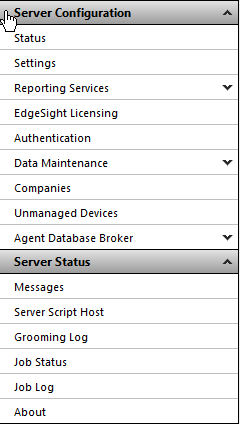
Server Configuration: Status Your first overview of server health comes when you click on Status under Server Configuration.
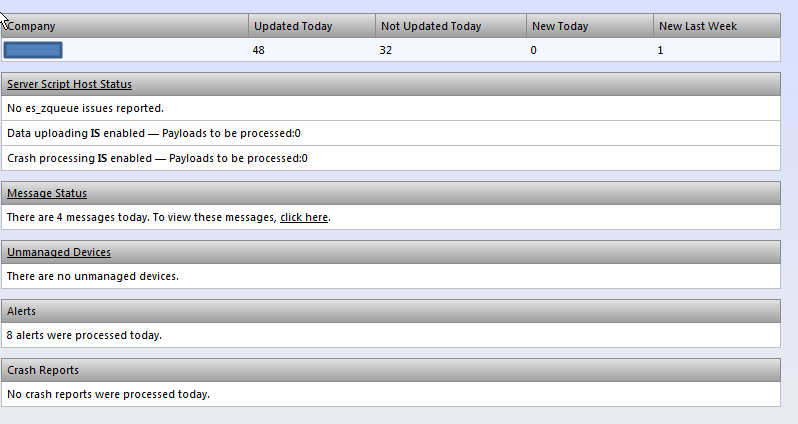
The first line lists the workers that were and were not updated in the current 24 hour period as well as newly added workers. Right away you see (in this case) that 48 workers updated and 32 did not. That’s a large portion of EdgeSight agents that have not uploaded their data into your database and therefore any reports you are running will not include these systems. The question becomes which systems did not update and why?
ES_ZQUEUE…Gesundheit!
The service on the EdgeSight server that processes payloads from the worker agents is the es_zqueue (seen under Server Script Host Status). This process is not reporting any issues and there are no pending payloads to process (we’ll look at this more later).
Server Status: Messages Message Status lists all the system messages generated by EdgeSight. This includes Agent errors, payload errors, and new agents alerts to name a few.
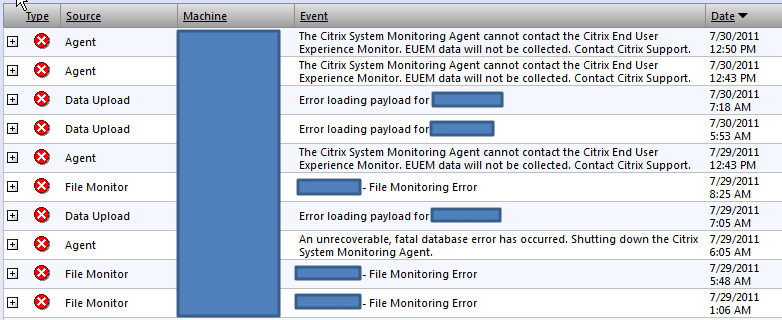
Here you will see which servers had a payload issue (Data Upload), but not a reason why systems have not updated the database.
Server Status: Server Script Host Clicking on this in your EdgeSight Console will show you the following screen:
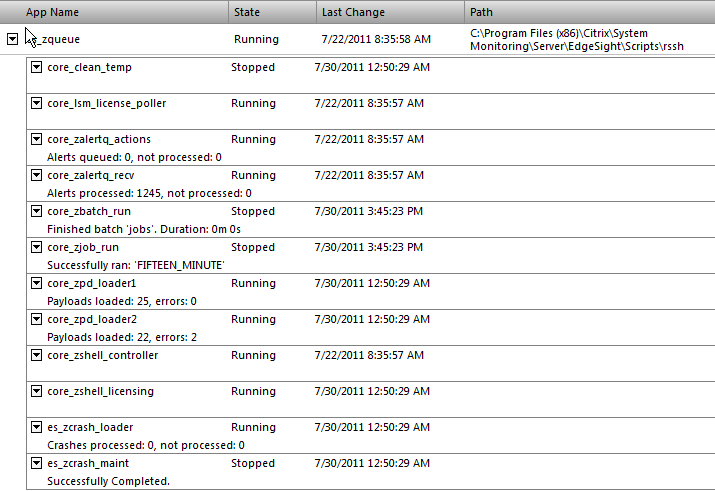
Here you will see the various modules that keep the EdgeSight database updated, cleaned, and running smoothly. The core_zpd_loader 1 and 2 manage the data payloads from devices with the EdgeSight agent including errors. Clicking on the triangle will reveal the following menu.
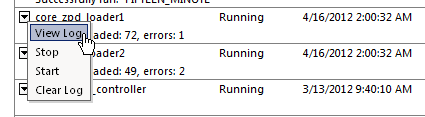
Clicking on View Log will allow us to investigate why a payload might have failed or created an error.
4/13/2012 5:18:03 AM: PayloadLoader: Starting payload load for C:\Program Files (x86)\Citrix\System Monitoring\Server\EdgeSight\Data\WebLoad\Inst_33.zpd 4/13/2012 5:18:11 AM: PayloadLoader: Payload load completed with errors for C:\Program Files (x86)\Citrix\System Monitoring\Server\EdgeSight\Data\WebLoad\Inst_33.zpd. Error: -2146233088: Citrix.EdgeSight.Loader. System.Exception
As we can see if this example, the payload completed with an error and we can try searching Citrix to see if there is a resolution related to this error, but we do not see which server failed to upload any data.
I’ve walked through the diagnostic information that is available in the EdgeSight console to show that we still do not have a clear sign of which servers have updated the EdgeSight database recently. To address this issue, I did some digging around in the EdgeSight database and created a query that links the instance, machine, and OS_version tables.
The Query
DECLARE @tzbias INT
SELECT @tzbias = case when use_daylight = '0' then standard_bias else daylight_bias end from timezone where tzid = 13
SELECT i.instid, m.name as 'System', ip_address AS 'IP', product_version AS 'ES Version',
CASE dept_set_type WHEN 1 THEN 'XenApp' WHEN 2 THEN 'Endpoint' END AS 'ES Agent',
CONVERT(VARCHAR,DATEADD(mi,@tzbias,last_sync),100) AS 'Last Sync',
CONVERT(VARCHAR,DATEADD(mi,@tzbias,last_config_start),100) AS 'Last Config Check',
CONVERT(DECIMAL(19, 2),(last_db_size/1048576.0)) AS 'Last FBDB Size (MB)',
CASE o.short_name WHEN 'Windows Server 2008' THEN 'W2K8'
WHEN 'Windows Server 2008 R2' THEN 'W2K8R2'
WHEN 'Windows Server 2003' THEN 'W2K3'
WHEN 'Windows XP' THEN 'XP'
ELSE 'Other' END AS 'OS',
CASE o.ptype WHEN 'Standard x64 Edition' THEN 'Std x64'
WHEN 'Professional' THEN 'Pro'
WHEN 'Enterprise Edition' THEN 'Ent'
WHEN 'Standard Edition' THEN 'Std'
WHEN 'Enterprise x64 Edition' THEN 'Ent x64'
ELSE 'Other' END AS 'Edition',
sp_level,
CONVERT(VARCHAR,DATEADD(mi,@tzbias,tstamp),111) AS 'Date Added',
cps_farm_name,i.cps_product_name, i.cps_product_version, i.cps_product_service_pack
FROM instance i,machine m, os_version o
WHERE m.machid=i.machid and i.osid = o.osid
ORDER BY dateadd(mi,@tzbias,last_sync) DESC
The Report
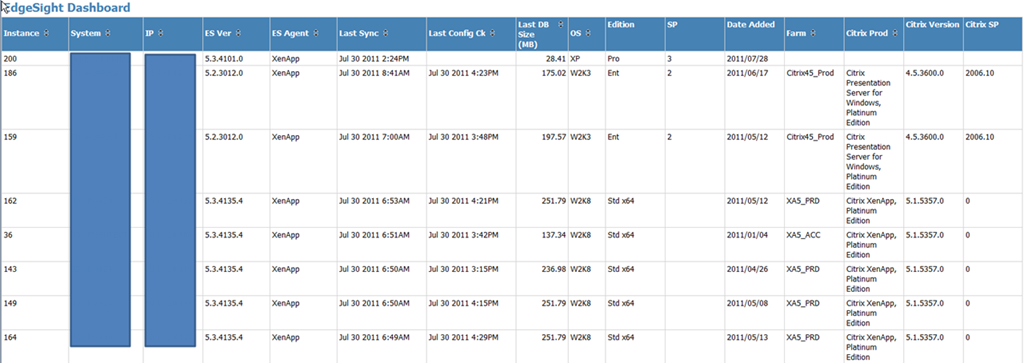
With this dashboard (I created it based on the query above in SQL Reporting Services) you can quickly see which servers have updated the database (Last Sync) and which have updated their local EdgeSight worker agents (Last Config Ck). Armed with this information you can review your EdgeSight Agent worker schedules or check the agent on the system in question to make sure it is communicating with the EdgeSight server.
As always I welcome all questions and comments.
Value for Value
If you received any value from reading this post, please help by becoming a supporter.
Thanks for reading,
Alain