Intro
In my experience, EdgeSight is not typically deployed in XenApp environments. The reasons for this are many:
- It seems redundant and overlaps with an already installed solution
- It’s hard to use (sorry Citrix, this is a great tool, but it almost requires a dedicated resource to manage it)
- Most XenApp administrators/managers do not know why or how it should be used
- Finally you need a platinum license in order to run the agent in advanced mode which is a deal-breaker for some companies.
In this post, I will cover a use case for EdgeSight that measures memory utilization of IE after a registry change is made.
Why Internet Explorer will kill your memory
Trond Eirik Haavarstein at XenAppBlog wrote a 2-part series on running Internet Explorer 7 or 8 in a terminal server environment and its impact on memory utilization. He shows how memory is used by multiple tabs in IE and references an MSDN Blog about a registry change that will modify the Tab Process Growth.
Any XenApp/Terminal Services environment is an exercise in resource management so we wanted to apply this change in our staging environment (prior to applying it in production) to determine if it will have a positive impact.
EdgeSight – Oh I get it!
After applying the registry change via a GPO, we waited a few days in order to gather enough data in EdgeSight to make a before/after comparison. Now we will walk through selecting the report we need and running it with the correct criteria.
Log into EdgeSight and go to the Browse Tab to select the report we need:
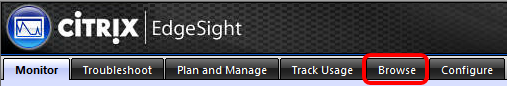
Here’s what you see…
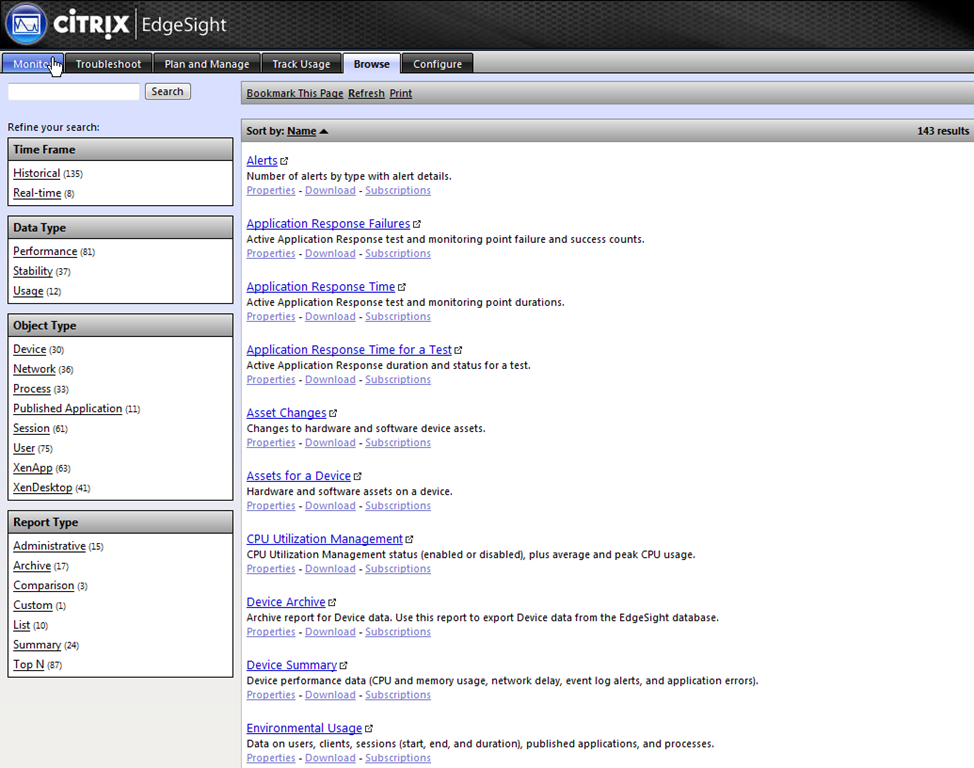
What! 143 reports? How do I get what I need? Well, we need to report on the performance of Internet Explorer. EdgeSight refers to applications as processes. These can be executables launched by users (published applications) or processes run by system accounts. Click on Process under the Object Type table. Now we see (click on the picture to make it bigger)…
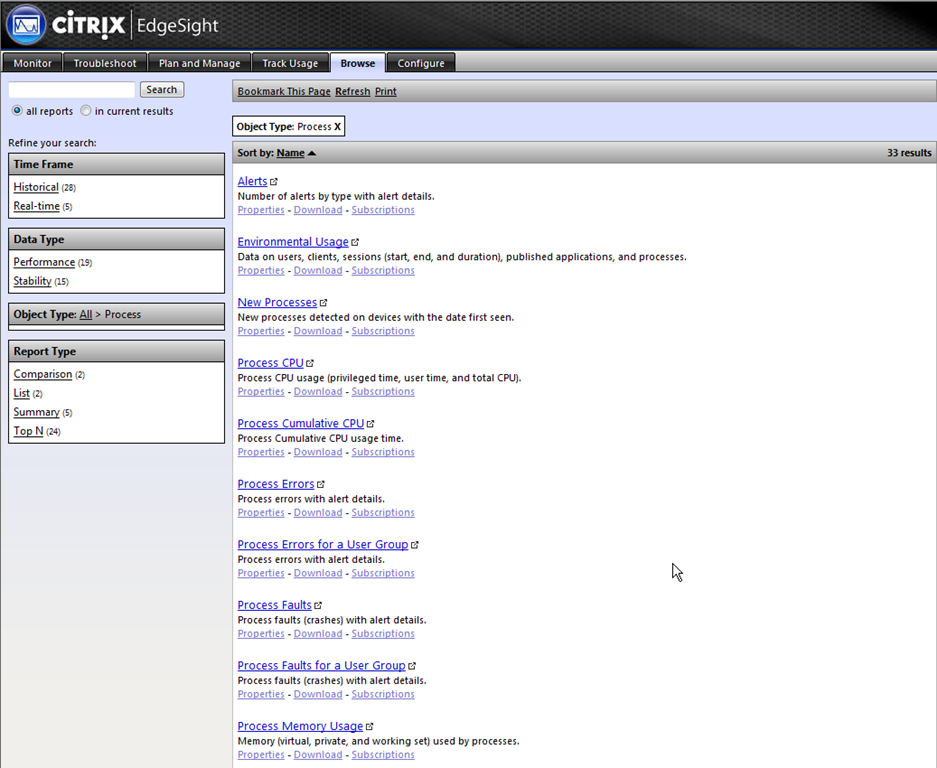
We’ve filtered our report list to just 33 items. If we wish to further filter our results, we can select Historical for the time frame and Performance for Data Type which gives us 15 reports to look through. Since we know we’re looking for a report related to memory, we could have just as easily typed “memory” in the search field which gives us the following…
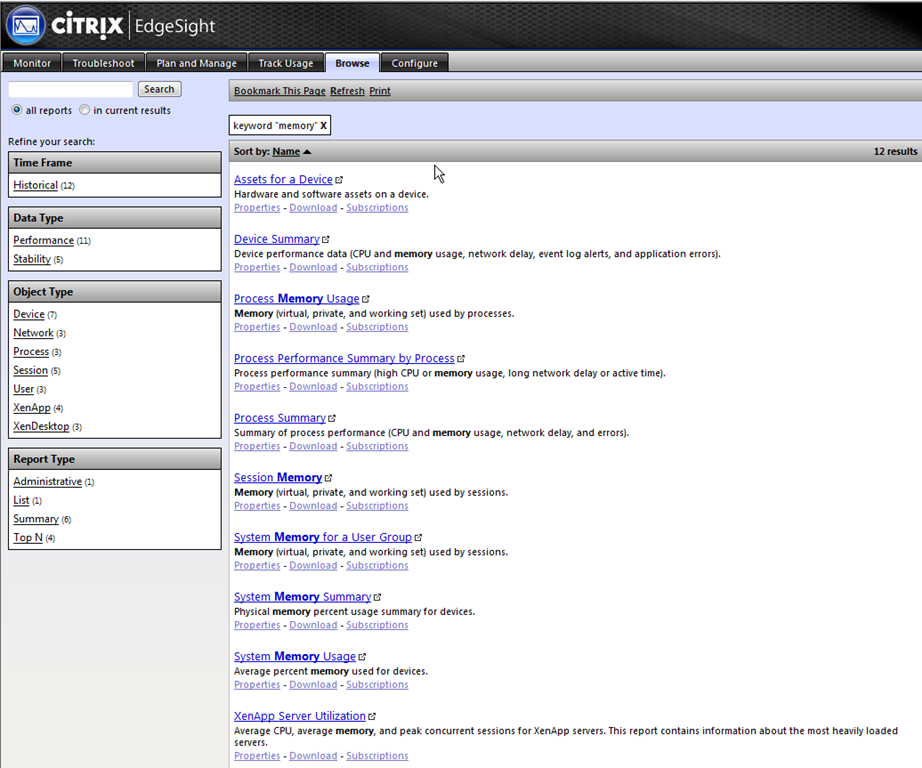
Then click on Processes for the Object Type would give us just 3 results…
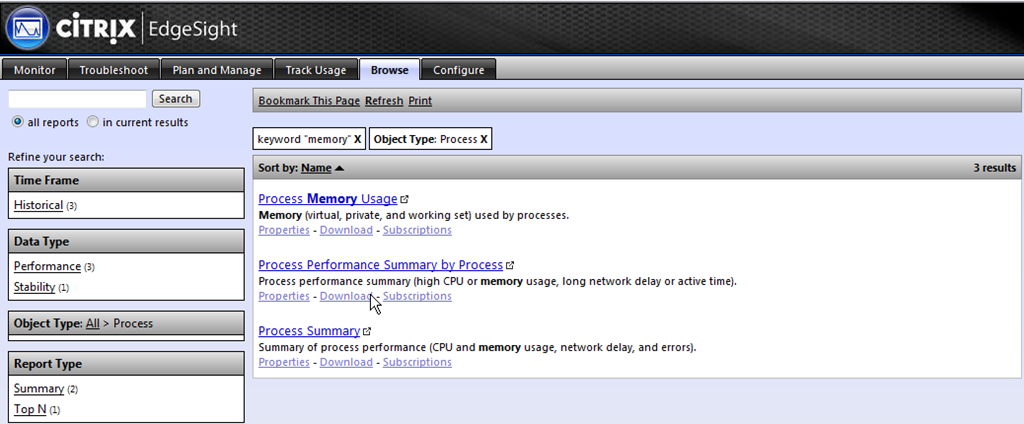
You can see that you can narrow your choices in a couple of different ways. The report we need is the Process Memory Usage. Let’s click on this report and see what the default result is.
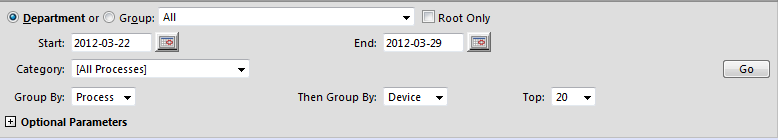
As you can see above, we are looking at the entire environment monitored by EdgeSight and looking at the top 20 processes for the past week. The resulting report is grouped by Process, then Device, and then user…
We need to narrow the parameters of this report to give us the info we need for Internet Explorer…
We can first choose to limit the Department to just our XenApp servers where we made the registry change. Next we can hit the Category drop down and select Web Browsers.
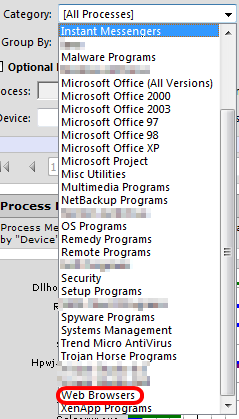
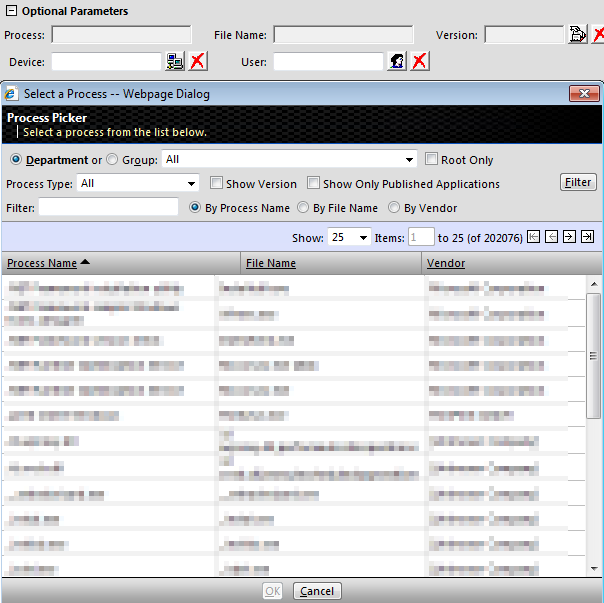
If you only have IE installed on your XenApp servers, this makes it easy. Otherwise, you will have to check the Optional Parameters and find the process in the Process Picker Window…
Type iexplore.exe into the Filter window, make sure the By File Name radio button is checked and click filter
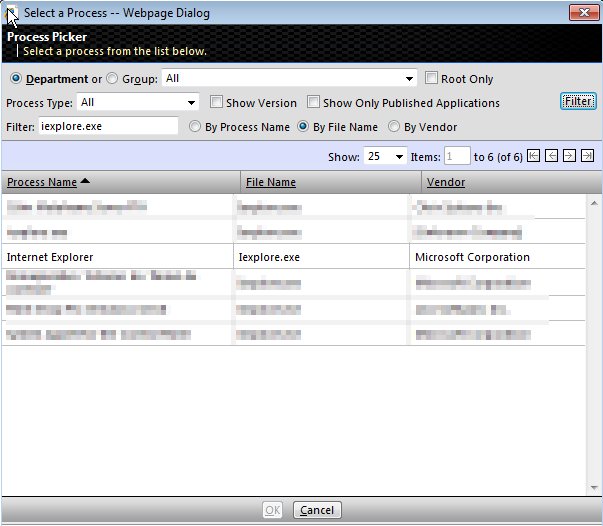
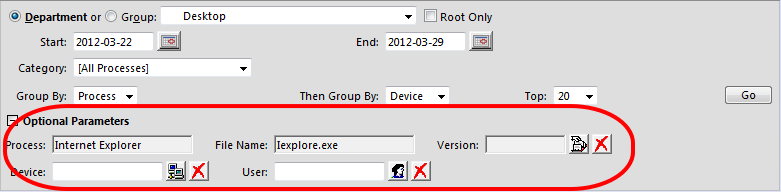
Select it and click Ok. Now Internet Explorer is the selected process in the Optional Parameters section.
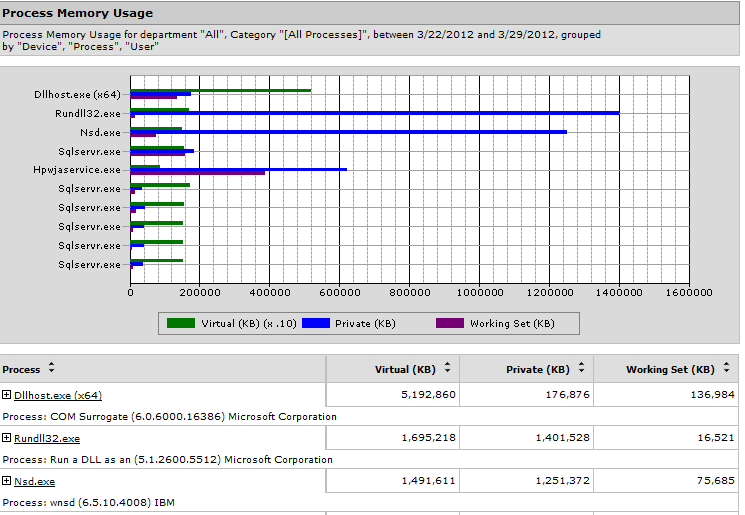
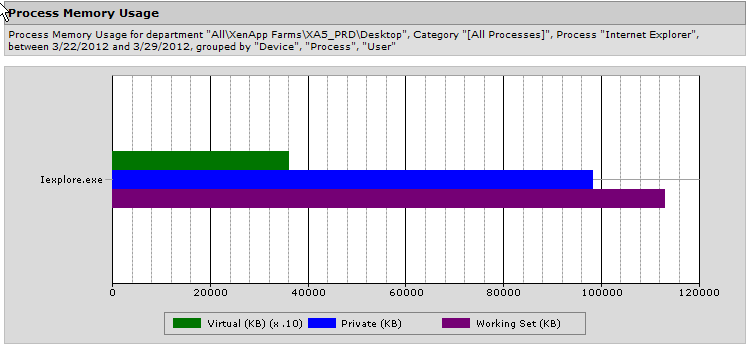
Clicking on Go will show us the top 20 instances of Internet Explorer’s usage of Virtual, Private, and Working Set memory over the period of 3/22 to 3/29. For a detailed explanation of memory, I would refer to Mark Russinovich’s blog post here.
We want to track the change in memory usage over time, so we have to modify how the data is grouped. Changing the grouping to Date, Process, and All gives us the following:
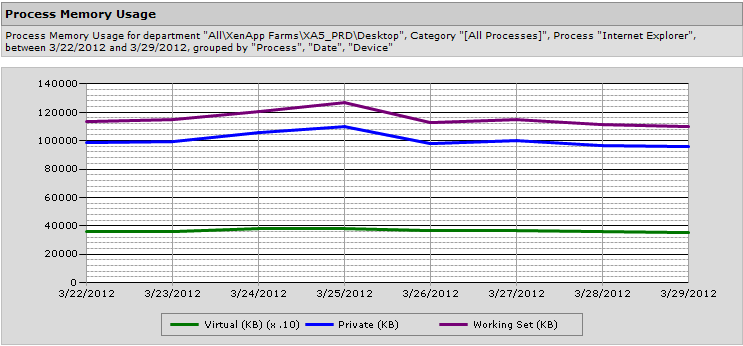
Now it’s a matter of selecting the correct dates and comparing the results to show how the change we made has positively impacted IE memory usage.
Here are the results I recorded with EdgeSight in our staging environment:
Before:
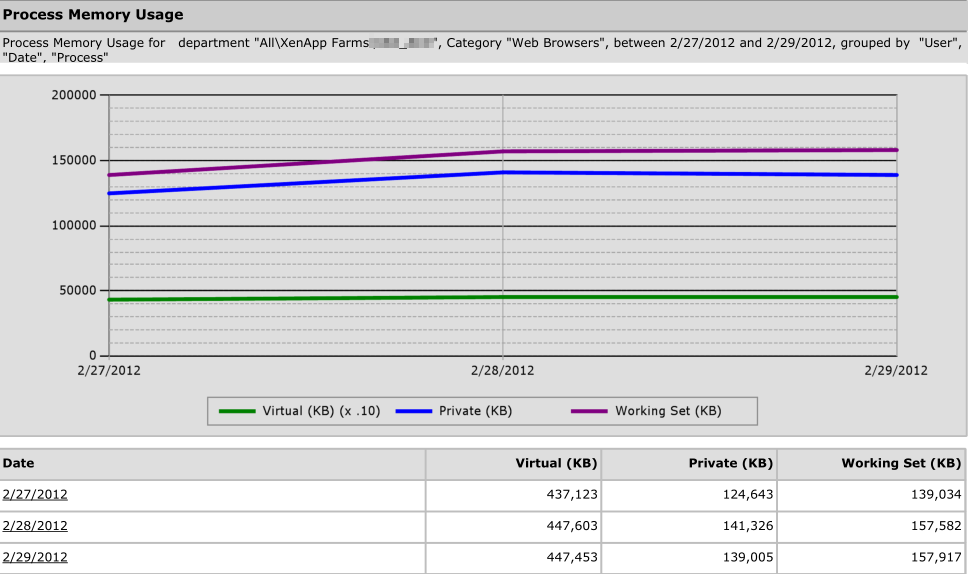
After:
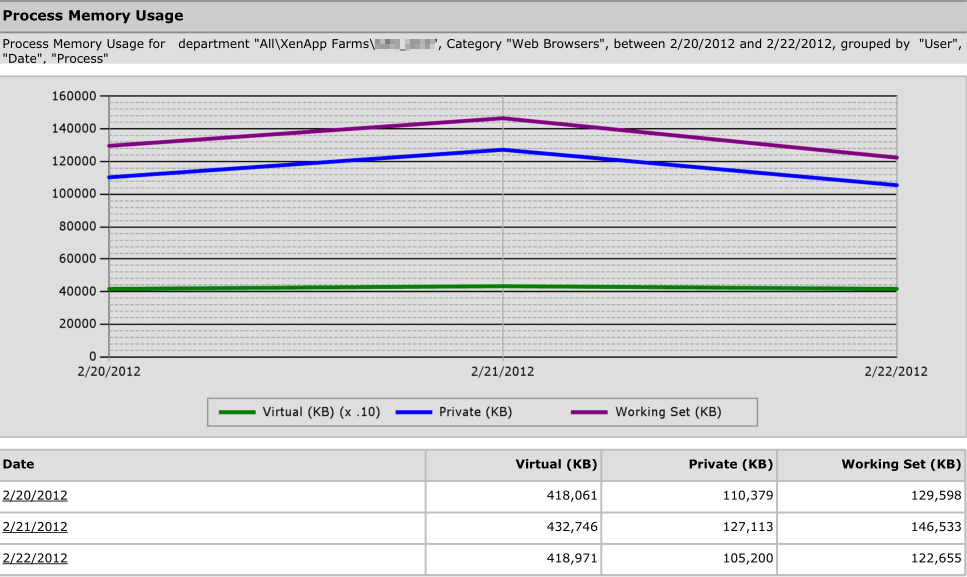
I found that the IE memory footprint was reduced by 10,000 – 30,000 kb after applying the registry change. That works out to around 10-30 MB per user which isn’t too bad in shared environment.
Have you tried this registry change and if so what was your result? How did you measure it? Comment Below
Value for Value
If you received any value from reading this post, please help by becoming a supporter.
Thanks for reading,
Alain